
Prometheus (website) has been used on and off by Thread since May 2015 (before I joined in June). Its a free software time series database which is very useful for monitoring systems and services.
There was a brief gap in use, but then I set it up again in October, driven by the need to monitor machine resources, and monitor the length of the queues (Thread use django lightweight queue). This proved very useful, as suddenly when a problem arose, you could look at the queues and machine stats which helped greatly in determining the correct course of action.
When using Prometheus, the server scrapes metrics from services that expose them (e.g. the prometheus-node-exporter). This is a common pattern, and I had already thrown together a exporter for django lightweight queue (that just simply got the data out of redis), so as new and interesting problems occured, I began looking at how Prometheus could be used to provide better visiblity.
PGBouncer
The first issue that I addressed was a fun issue with exausting the pgbouncer connection pool. The first time this happened, it was only noticed as emails were being sent really slowly, and eventually it was determined that this was due to workers waiting for a database connection. PGBouncer does expose metrics, but having them in Prometheus makes them accessible, so I wrote a Prometheus exporter for PGBouncer.
The data from this is displayed on relevant dashboards in Grafana, and has helped more than once to quickly solve issues. Recently, the prometheus-pgbouncer-exporter was accepted in to Debian, which will hopefully make it easy for others to install and use.
HAProxy logs
With the success of the PGBouncer exporter, I recently started working on another exporter, this time for HAProxy. Now, there is already a HAProxy exporter, but the metrics which I wanted (per HTTP request path rates, per HTTP request path response duration histograms, ...) are not something that it offers (as it just exposes metrics on the status page). These are something that you can get from the HAProxy logs, and there are existing libraries to parse this, which made it easier to put together an exporter.
It was using the data from the HAProxy log exporter that I began to get a better grasp on the power of aggregating metrics. The HAProxy log exporter, exports a metric haproxy_log_requests_total and this can have a number of labels (status_code, frontend_name, backend_name, server_name, http_request_path, http_request_method, client_ip, client_port). Say you enable the status_code, server_name and http_request_method labels, then, if you want to get a rate of requests per status code (e.g. to check the rate of HTTP 500 responses), you just run:
sum(rate(haproxy_log_requests_total[1m])) by (status_code)
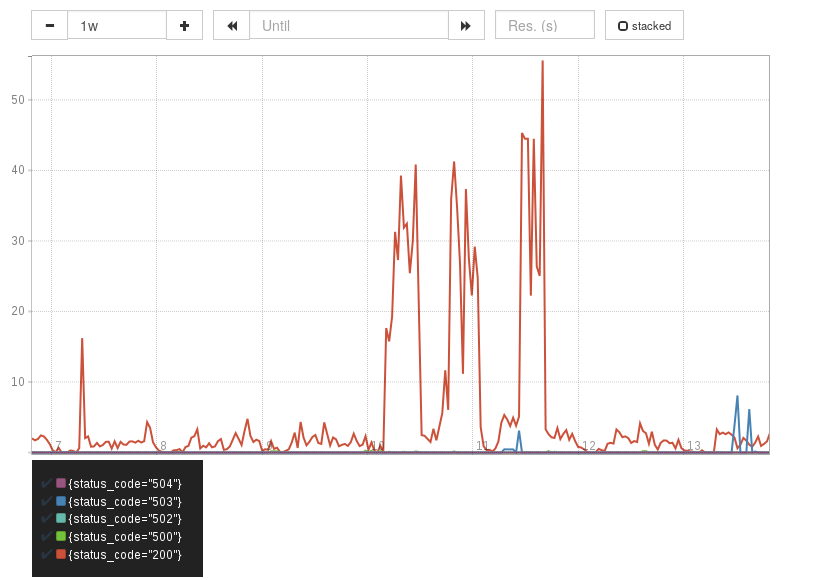 Per second request rates, split by status code (key shown at the bottom).
Perhaps you want to compare the performance of two servers for the different request paths, you would run:
sum(
  rate(haproxy_log_requests_total[1m])
) by (
  http_request_path, server_name
)
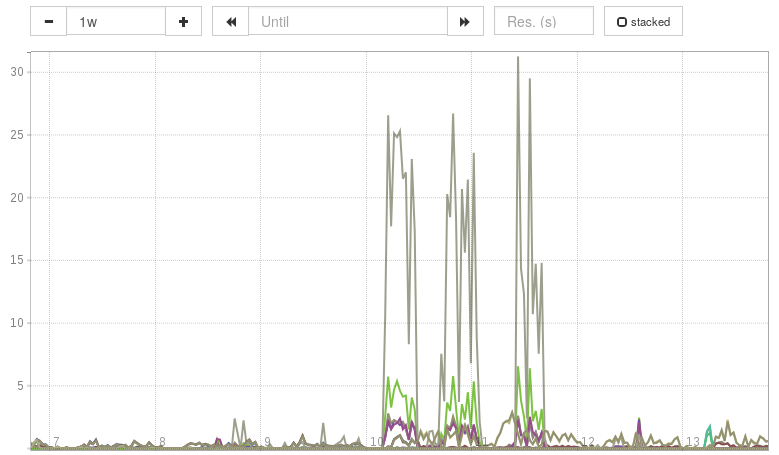 Each metric represents the request rate for a single request path (e.g. /foo)
for a single server.
Each metric represents the request rate for a single request path (e.g. /foo)
for a single server.
And everything you can do with a simple counter, you can also do with histograms for response duration. So say you want to know how a particular request path is being handled over a set of servers, you can run:
histogram_quantile(
  0.95,
  sum(
    rate(haproxy_log_response_processing_milliseconds_bucket[20m])
  ) by (
    http_request_path, le, server_name
  )
)
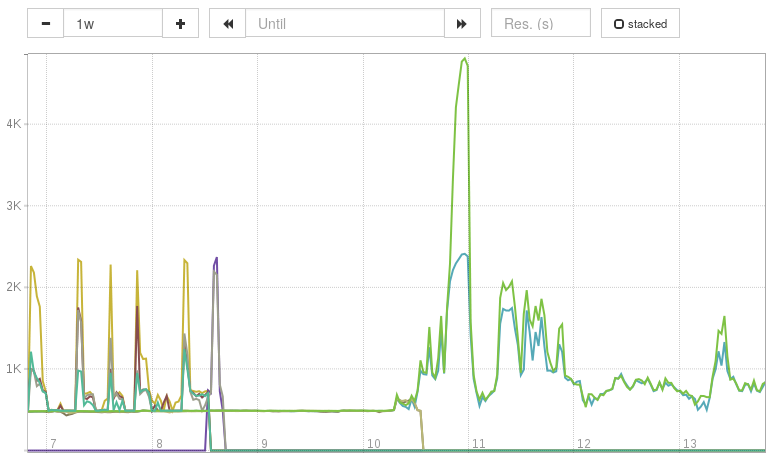 Each metric represents the 95 percentile request rate for a single request
path, for a single server.
Each metric represents the 95 percentile request rate for a single request
path, for a single server.
This last query is aggregating the culamative histograms exported for each set of label values, allowing very flexible views on the response processing duration.
Next steps
At the moment, both exporters are running fine. The PGBouncer exporter is in Debian, and I am planning to do the same with the HAProxy log exporter (however, this will take a little longer as there are missing dependencies).
The next things I am interested in exploring in Prometheus is its capability to make metrics avaialble for automated alerting.